A very fast Network Scanner and Ping Monitoring tool-set designed for network administrators who need near real-time LAN/WAN status at a glance. No .NET framework or Java SDK required — just install and go.
- Requires Windows Server 2008+ or Windows Vista+.
- No .NET framework or JAVA SDK dependency!
- Community Edition is fully featured, free forever — not a crippled demo.
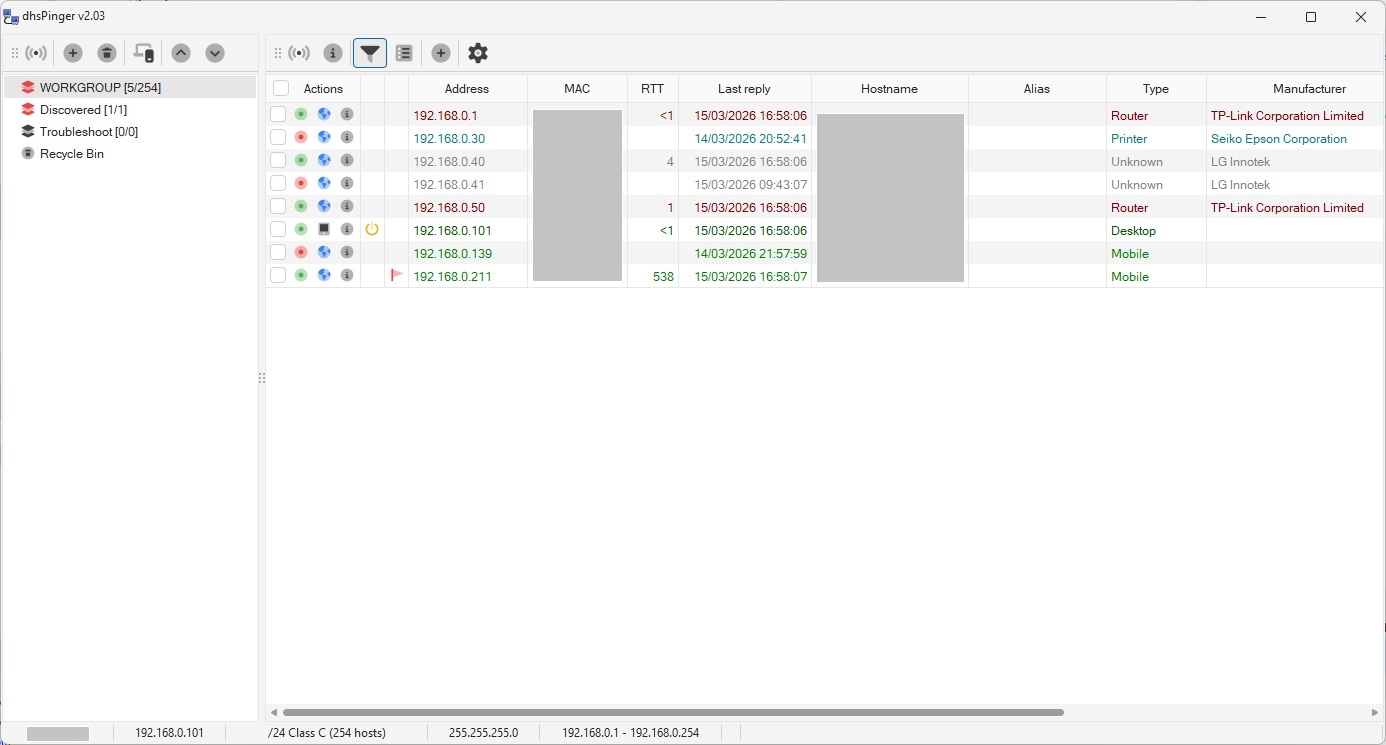
Network Scanner
Discover all IPv4 devices on your network with a lightning-fast scanner. Automatically detects hostnames via reverse DNS, MAC addresses via ARP, device manufacturers from a 40,000+ entry IEEE/Wireshark vendor database, and classifies device types (workstation, server, router, switch, printer, mobile, and more). Supports DynDNS and FQDN hostnames with async DNS resolution.
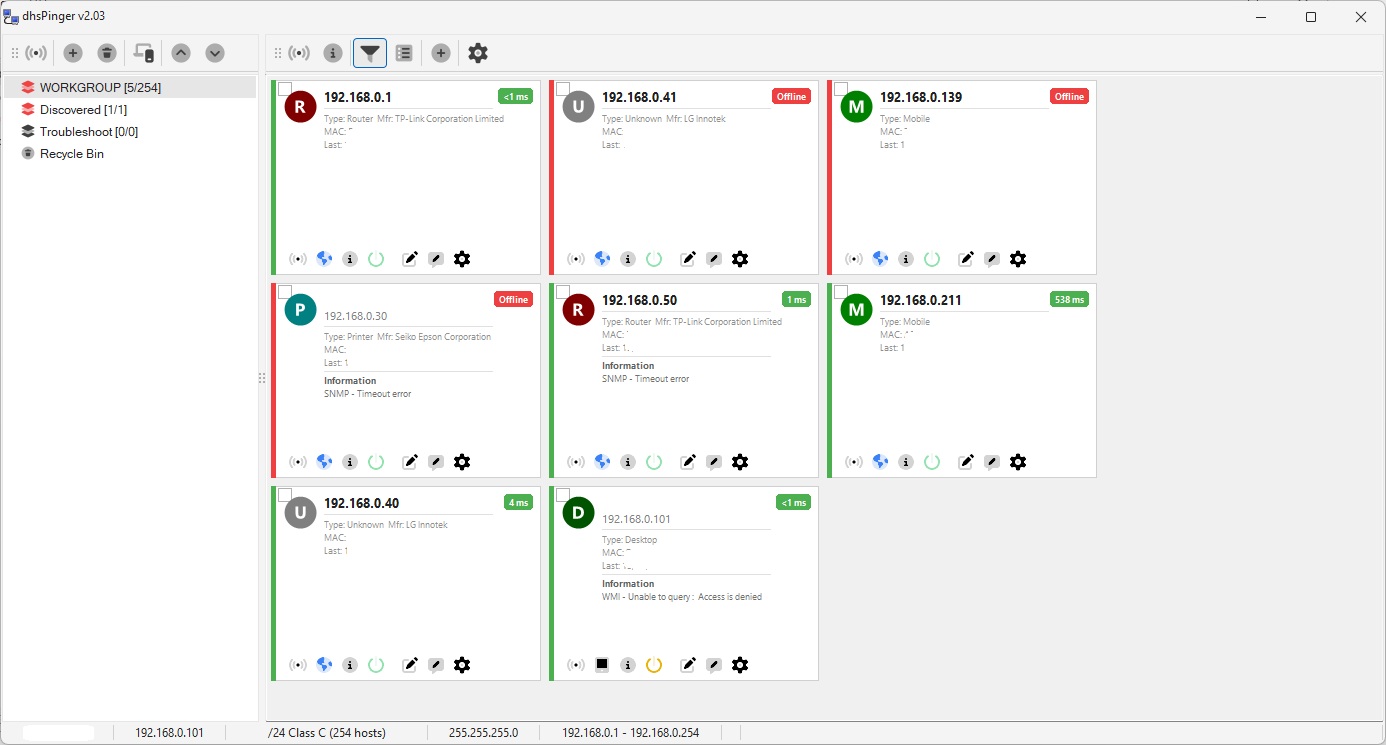
Device Card View
Switch from the grid to a visual card layout for a quick overview of your monitored devices. Each card shows the device type, IP address, manufacturer, response time, and SNMP information at a glance — with per-device action buttons for ping, Wake-on-LAN, remote desktop, troubleshooting, and more.
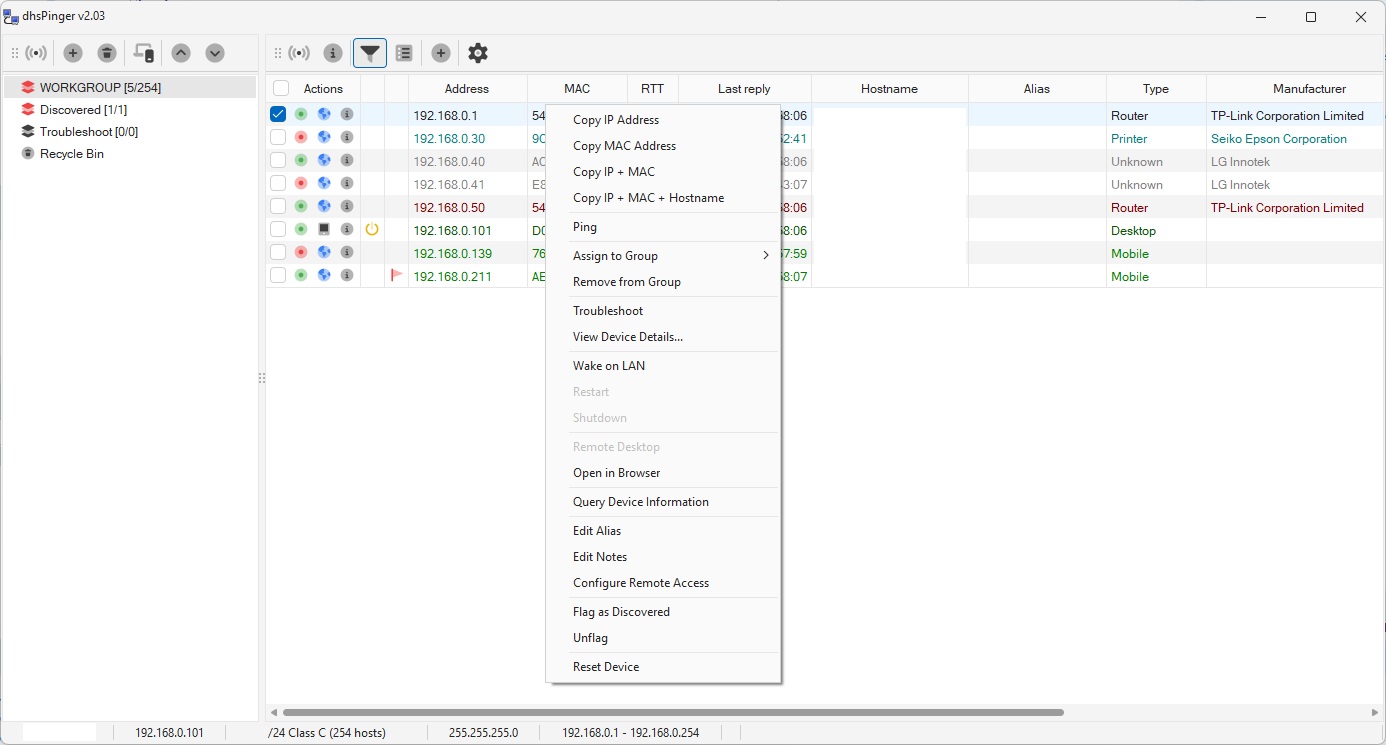
Device Actions & Remote Management
Right-click any device for a full set of management actions: copy addresses, ping, Wake-on-LAN, remote shutdown or restart via WMI, open Remote Desktop (RDP) sessions, launch in browser, query device information (OS, CPU, memory, storage via WMI), poll via SNMP, edit aliases and notes, assign to groups, and troubleshoot — all from a single context menu.
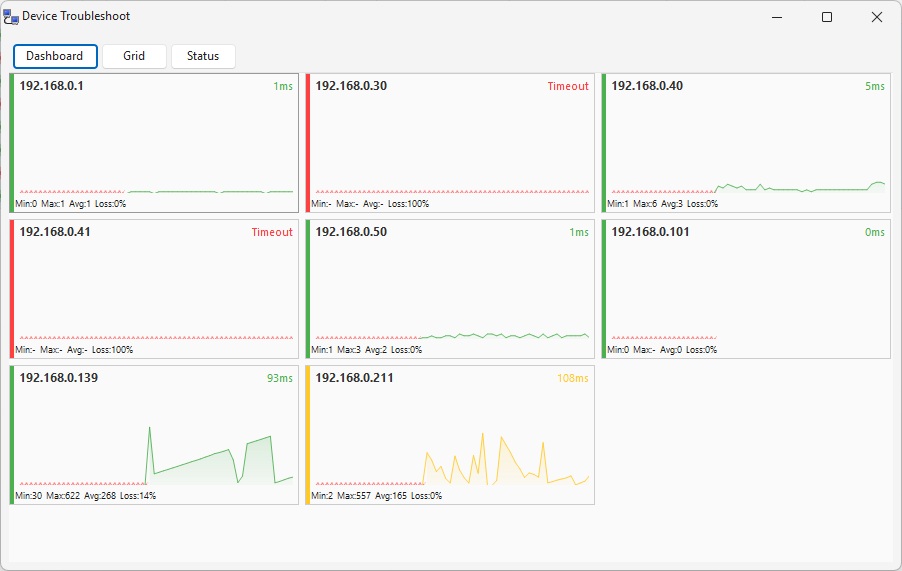
Troubleshoot Dashboard
A NOC-style dashboard with live sparkline charts for every monitored device. Each panel shows real-time ping response times with color-coded status: green for healthy, yellow for warning, red for critical or timeout. Min/Max/Average RTT and packet loss percentage are displayed per device — giving you an instant visual health check of your entire network.
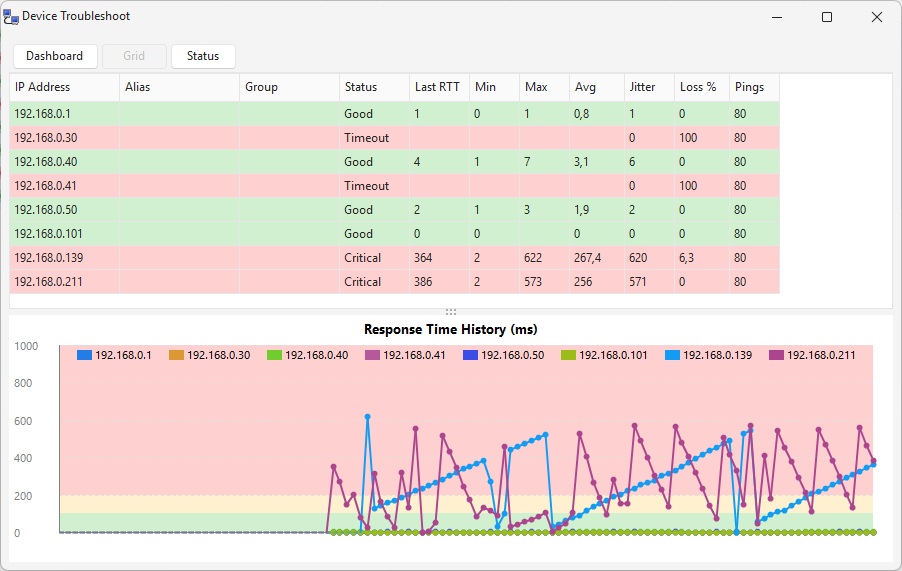
Status & Performance Analytics
The Status view combines a detailed statistics grid with a Response Time History chart. See Last RTT, Min, Max, Average, Jitter, Loss percentage, and total pings for every device. The timeline chart plots response times across all devices simultaneously, making it easy to spot patterns, correlate slowdowns, and identify intermittent issues across your network.
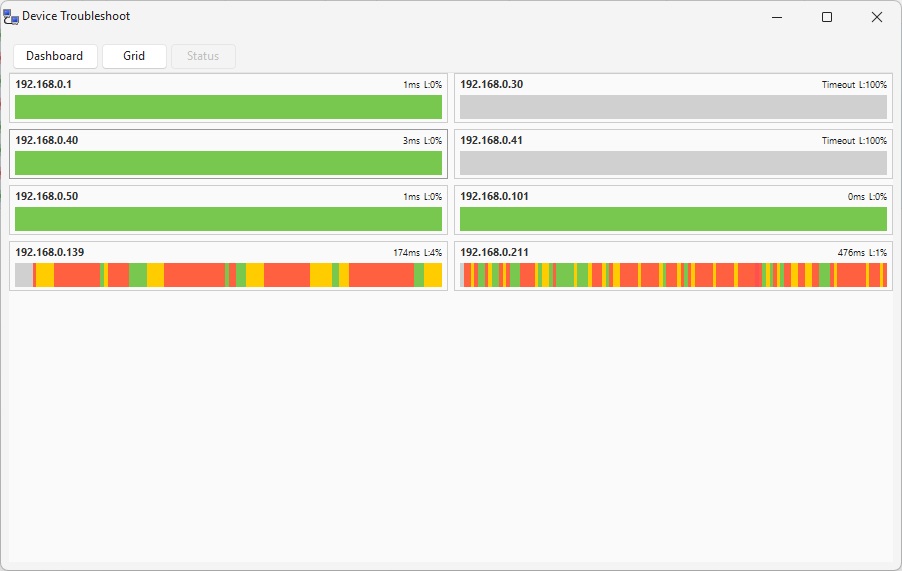
Troubleshoot Grid
A color-coded state timeline that visualizes ping health over time with horizontal bars. Green segments indicate healthy responses, yellow marks elevated latency, red shows critical response times, and gray means timeout. Instantly spot intermittent connectivity problems and network degradation patterns at a glance.
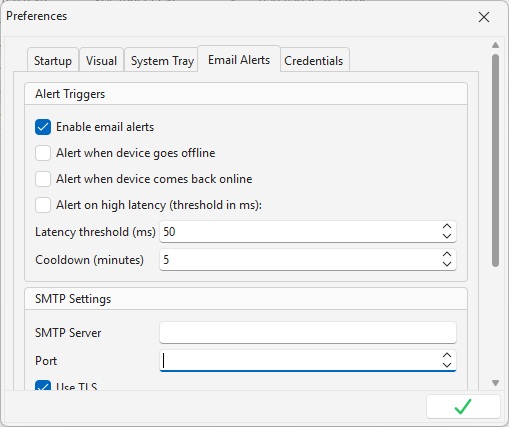
Email Alerts & Notifications
Configure SMTP email alerts to get notified when devices go offline, come back online, or exceed latency thresholds. Supports TLS encryption and custom SMTP servers. Set alert cooldown intervals to avoid notification spam during flapping events. Test your configuration with a single click.
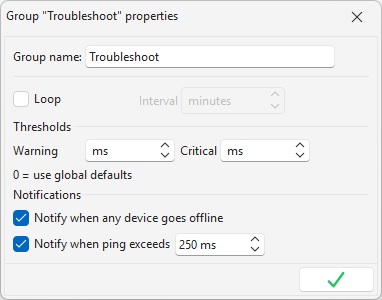
Group Management
Organize devices into groups with independent monitoring configurations. Each group supports its own ping loop interval, custom warning and critical RTT thresholds that override global defaults, and per-group notification rules — notify on any device going offline, or only when ping exceeds a custom threshold. One device can belong to multiple groups simultaneously.
The Community Edition has no time limit, no advertisements, and no feature crippling — it is genuinely free for personal and commercial use.
Licenses are valid for an entire major release series (e.g. all 2.x versions). Minor updates and patch releases are always free within the same major version.